Analytics
Info
Who can use this feature?
- This feature is available for all users
What is Analytics?
Analytics provides comprehensive insights into your customer conversations, AI assistant performance, sales contribution, and FAQs engagement.
This feature helps you track key metrics to understand how you're supporting customers and what you can improve.
What Analytics provide
Chatty Analytics gives you three main areas of insight:
- Dashboard overview: Quick performance snapshots right from your dashboard
- Human agent: Performance metrics for conversations handled by your team
- AI assistant: Insights into how your AI is handling customer inquiries
- Sales: Revenue and conversion tracking from customer interactions
- FAQs: Data on how customers are engaging with your self-serve FAQs
How to use Analytics
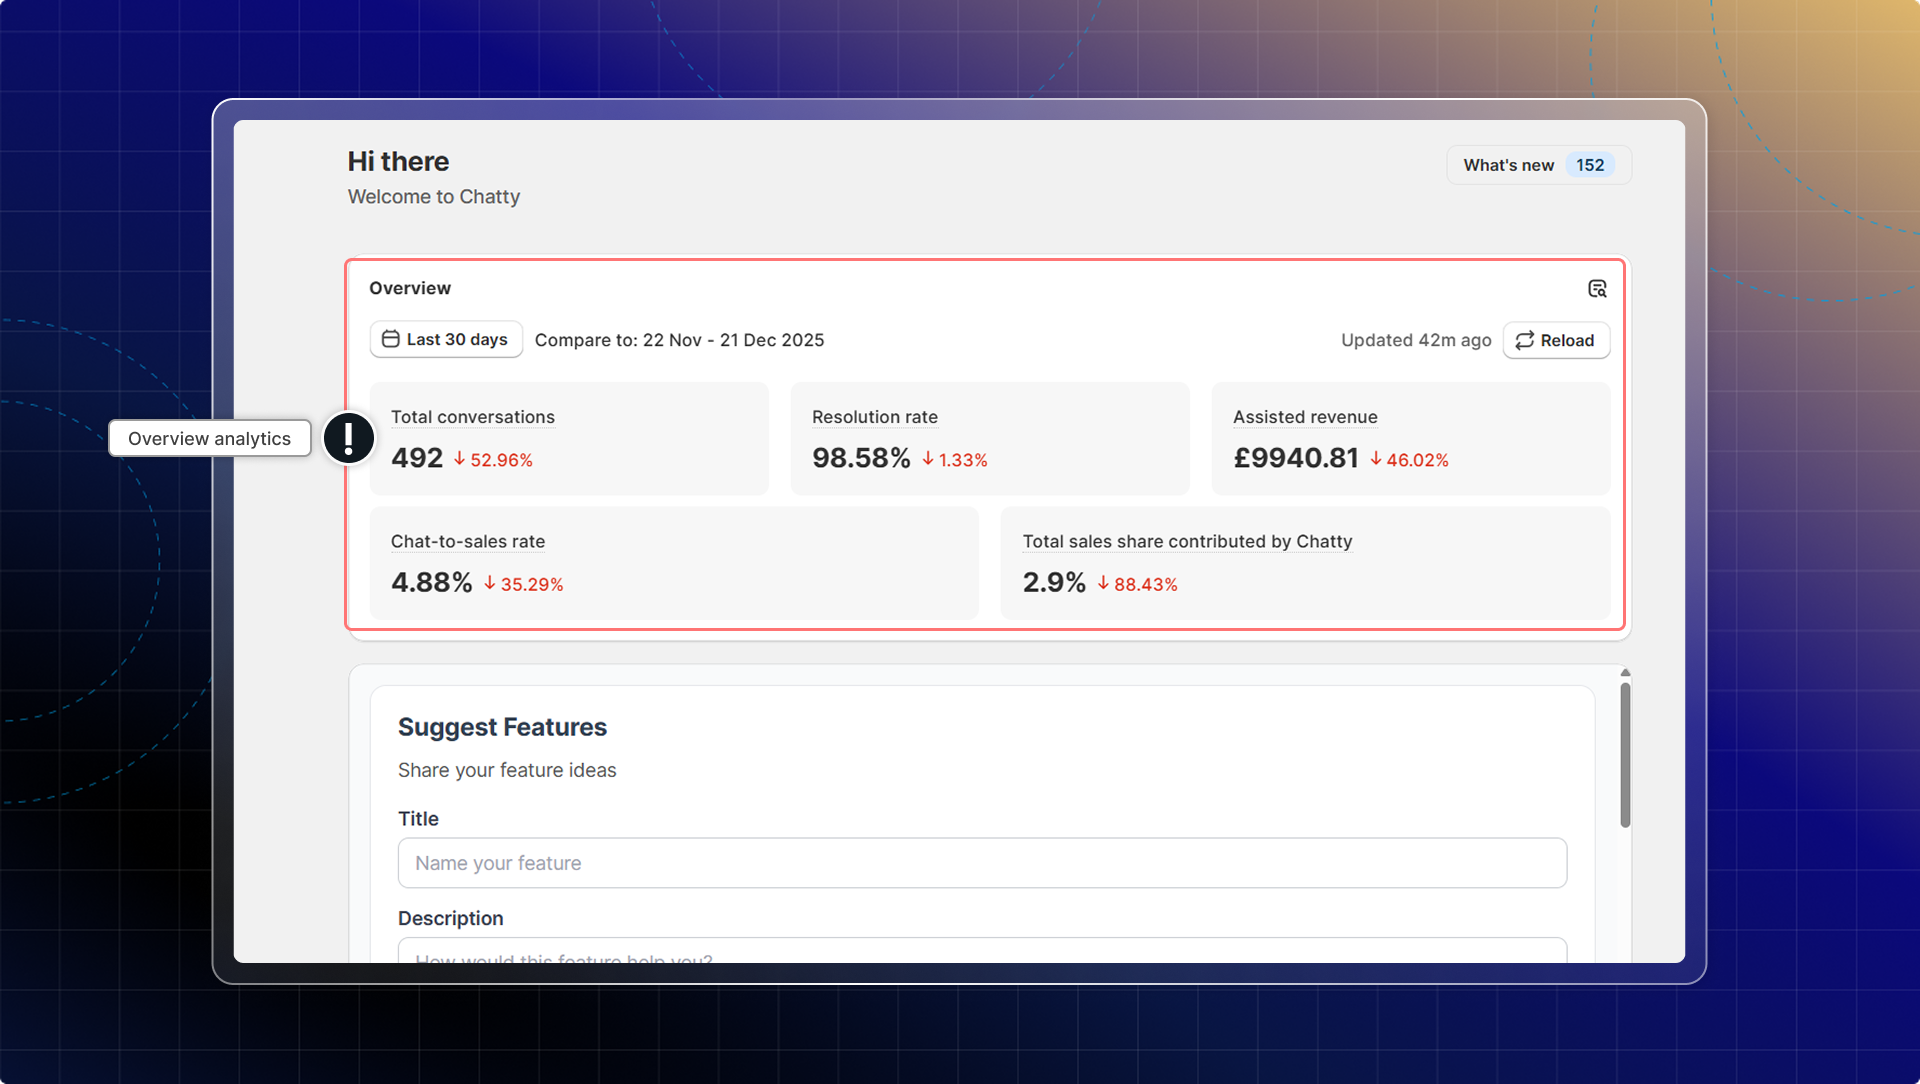
Dashboard overview
The dashboard provides a quick overview of your most important metrics
- In Dashboard, go to Overview to check analytics overview.
- Analytics overview is shown in the Dashboard:
- Total conversations: All conversations in the selected time range
- Chat-to-sales rate: Percentage of conversations of customers who make orders
You can select a time range to filter your analytics. Or click Reload to refresh the latest data.
Detailed analytics
For more comprehensive data:
- Go to the Analytics
- Use the time filter at the top to select your date range
- Compare current data with the previous periods using the comparison
- Check trend charts to identify patterns
- Click Reload to refresh the data
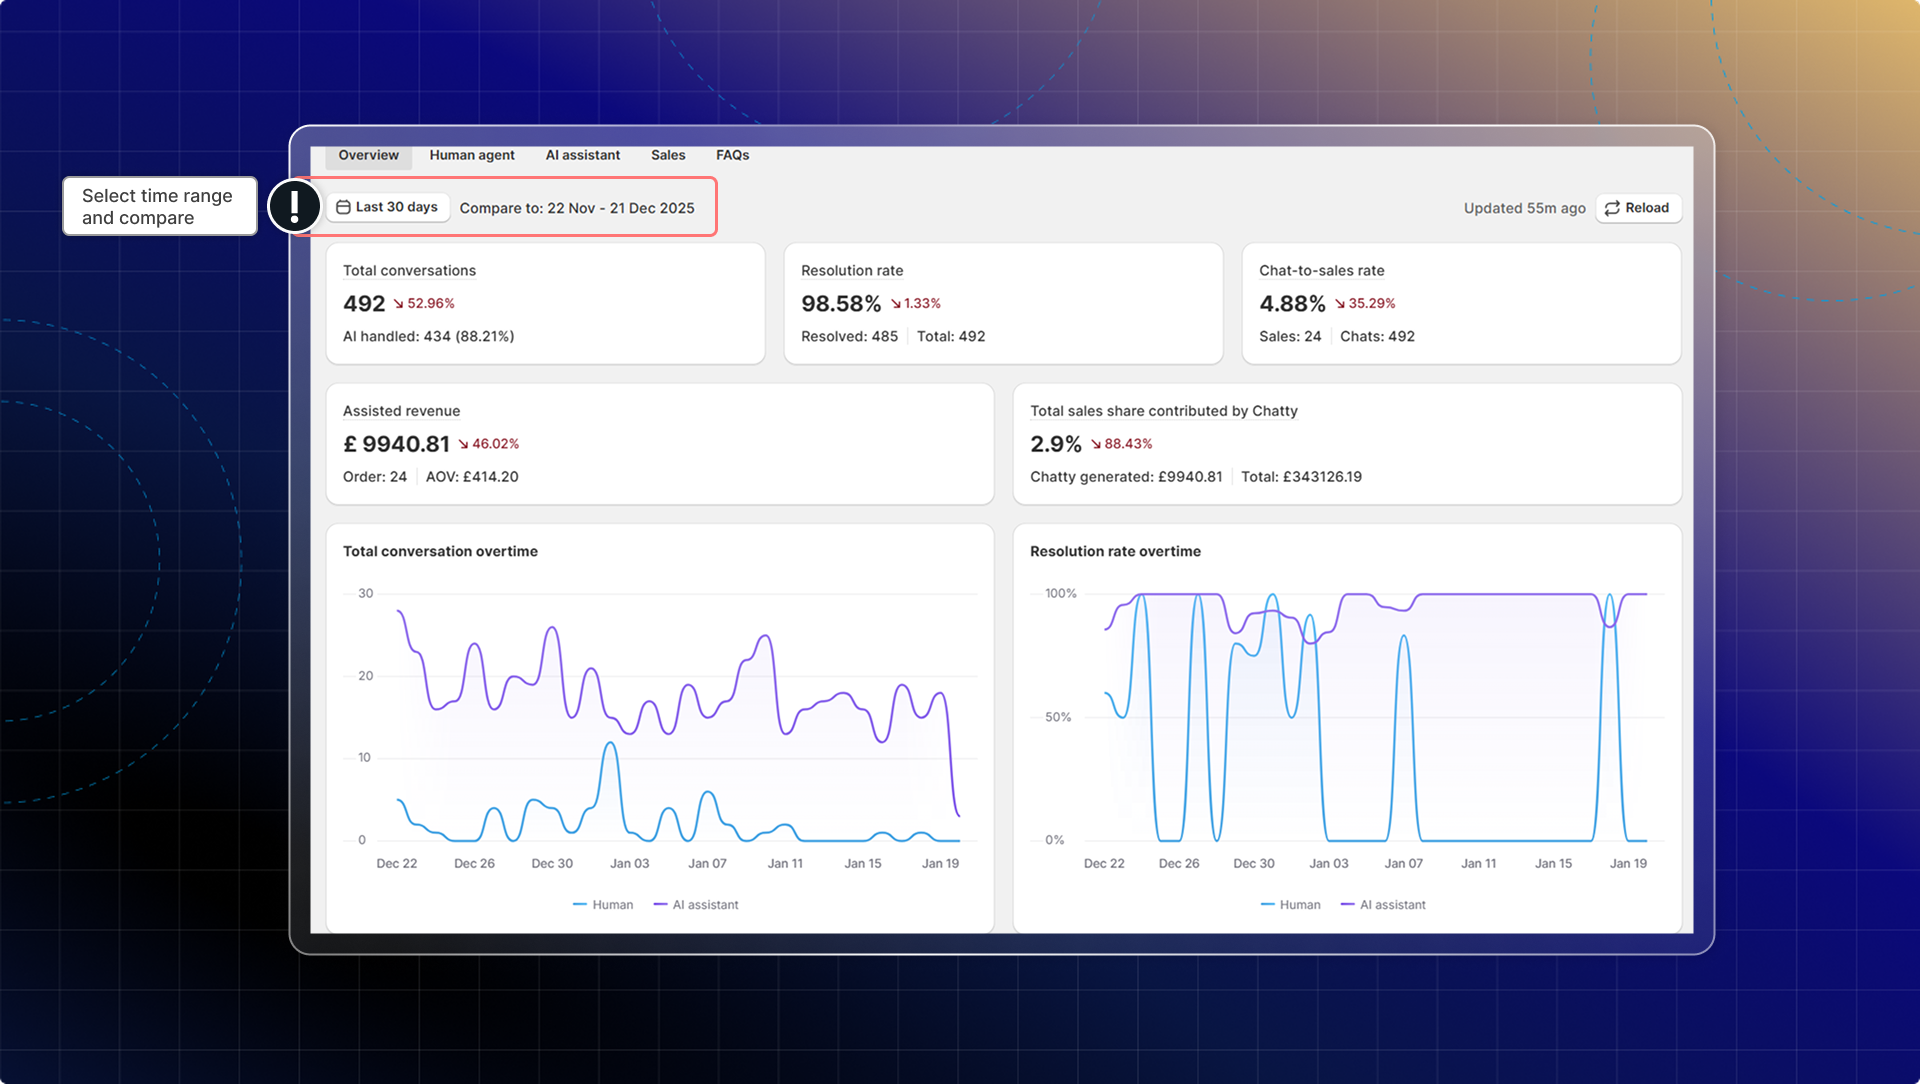
What's in Analytics
| Overview tab | |
|---|---|
| Total conversations | Total number of conversations |
| Resolution rate | Percentage of conversations that were resolved |
| Chat-to-sales rate | Percentage of conversations that resulted in direct sales |
| Assisted revenue | Total revenue generated from Chatty interactions |
| Total sales share contributed by Chatty | Percentage of total store revenue generated from Chatty interactions |
Human agent
Measure your team's performance when handling customer conversations
| Human agent | |
|---|---|
| Total conversations | New conversations assigned to human agents |
| New conversations | The number of conversations started in the selected period |
| Resolved conversations | Conversations resolved by human agents |
| First response time | Average time for human agents to send the first response |
| Handling time | Average time human agents take from conversation start to resolution |
| Resolution time | Average time from assignment to resolution for human-handled conversations |
AI Assistant
Show how effectively your AI assistant is handling customer inquiries
| AI Assistant | |
|---|---|
| AI involved rate | Percentage of conversations where AI participated |
| AI resolution rate | Percentage of AI-handled conversations successfully resolved without human intervention |
| Answer rate | Percentage of customer messages that AI successfully answered |
| Time saved | Estimated time saved by using AI to handle conversations |
Sales
Understand how customer conversations contribute to your store revenue
| Sales | |
|---|---|
| Total sales | Revenue generated from both direct and indirect customer interactions with Chatty |
| Total store revenue share | Percentage of total revenue contributed by Chatty interactions |
| Total orders | Number of orders from customers who interacted with Chatty |
| AOV | (Average Order Value) Average order value from Chatty-attributed sales |
| Conversation rate | Percentage of customers who made a purchase after interacting with Chatty |
| Customer feedback | The analytics of total "thumb up" and "thumb down" in each AI response |
FAQs
Track customer engagement with your self-service content and identify which questions matter most
| FAQs | |
|---|---|
| Published FAQs | Total number of published FAQ articles |
| Total views | How many times your FAQs have been viewed |
| FAQ views over time | View trends to see when customers are accessing your FAQs |
| Top viewed FAQs | Your most popular FAQ content |